Benchmark information, as well as student data regarding the benchmarks, can be found on the Assessment Scores and Review Report. If your state uses specific benchmarks that are different from the national ACT benchmarks, that information will be properly represented in this report.
Grade 9 students in CERT have access to PreACT assessments. PreACT assessments are predictive of how students will do on the full-length ACT assessment for English, math, reading, and science. The PreACT results can be used to help students make important adjustments to their current coursework to ensure they are prepared for the ACT. PreACT and ACT report on a common scale of 1 to 36, giving educators a simple way to see the current projected ACT score for the student.
Since growth is expected from grades 9 to 11, students who score below benchmark on the College Readiness Benchmarks on PreACT still may be on target to meet the benchmark in 11th grade. The College Readiness Indicators, developed by ACT, are an additional way to evaluate student readiness. These indicators categorize the student into one of three readiness levels. These levels are On Target, On the Cusp, and In Need of Intervention. See the screenshot below that details what these College Readiness Indicators are, as well as the definition of each category.
PreACT READINESS BENCHMARKS


Teachers and Admin can quickly see which students are IN NEED, AT CUSP, or ON TARGET.
1. From the REPORTS tab, choose the Assessment Scores and Review Report.
2. Select READINESS INDICATORS from the Score Menu.
3. FILTER DATA, as desired, and UPDATE REPORT.
- On Target: students in this range have a 50% or higher chance of meeting the ACT College Readiness Benchmark in grade 11.
- On the Cusp: these students have less than a 50% chance, but greater than approximately 25% chance, of meeting the ACT College Readiness Benchmark in grade 11.
- In need of Intervention: these students have less than a 25% chance of meeting the ACT College Readiness Benchmark in grade 11.
Readiness Indicators are listed on the right-hand side. Each Readiness Level is interactive. Select the Readiness Level and the students will populate that comprise that category.

Select the ❓by the subject names to see pertinent information regarding PreACT College Readiness Indicators and cut scores.

ACT READINESS BENCHMARKS
For students in grades 10 through 12, the benchmarks set forth either by your state or by ACT, can be found on this report as well. These benchmarks are next to each of the four content areas as displayed below.
- From your REPORTS tab, select the ASSESSMENT SCORES AND REVIEW REPORT.
- Choose ACHIEVEMENT for score type.
- FILTER DATA, as desired, and UPDATE REPORT,

Select the❓by the subject names to see pertinent information regarding ACT cut scores.

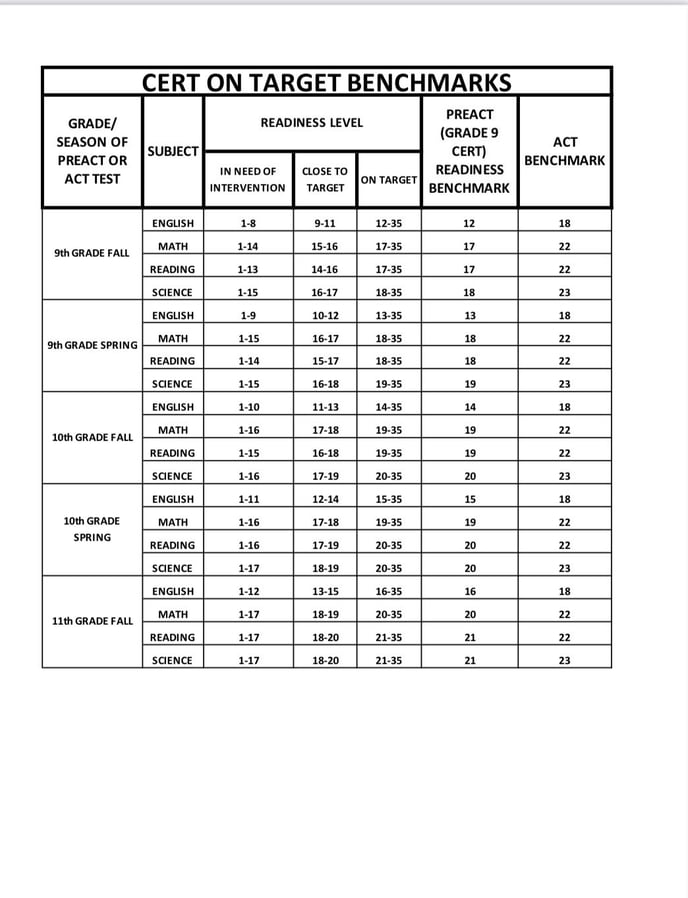
CERT ON TARGET BENCHMARKS
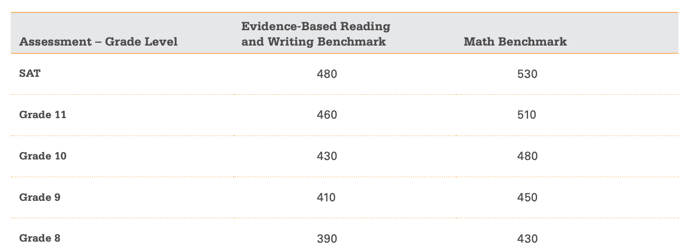
DSAT BENCHMARKS
The College and Career Readiness Benchmarks for the SAT ® Suite of Assessments The College Board Readiness and Success System helps students and educators prepare for success after high school. The SAT® Suite of Assessments — including the SAT, the PSAT/NMSQT® , the PSAT™ 10, and the PSAT™ 8/9 — is an essential component of the system. These assessments focus on the few things that research shows matter most for college and career readiness, and in doing so reflect what students are already learning in school. They help students and educators monitor academic progress and prepare students to achieve their college and career goals. Scores from these assessments are on a common score scale and integrated into comprehensive score reports so students and educators can more easily track and measure academic growth over time. The Benchmarks Defined Each assessment in the SAT Suite has an associated set of metrics called the college and career readiness benchmarks. The new college and career readiness benchmarks are based on actual student success in entry-level college courses. Benchmarks are set at the section level (Math, Evidence-Based Reading and Writing) for each assessment and represent increasing levels of achievement as students progress from grade eight through grade 12. The SAT benchmark scores represent a 75% likelihood of a student achieving at least a C grade in a first-semester, credit-bearing college course in a related subject. » The SAT Math benchmark is the SAT Math section score associated with a 75% chance of earning at least a C in first-semester, creditbearing, college-level courses in algebra, statistics, precalculus, or calculus. » The SAT Evidence-Based Reading and Writing benchmark is the SAT Evidence-Based Reading and Writing section score associated with a 75% chance of earning at least a C in first-semester, creditbearing, college-level courses in history, literature, social science, or writing. The grade-level benchmark scores are based on expected student growth toward the SAT benchmarks at each grade. Where SAT benchmarks indicate likelihood of success in college, grade-level benchmarks indicate whether a student is on track for college and career readiness for their grade. The benchmarks are set to reflect typical annual growth from year to year from eighth through 12th grades, where the SAT benchmarks reflect a high probability of successfully earning a passing grade in courses specifically linked to the two SAT section scores. The benchmarks for the SAT Suite of Assessments work together as a system, making it easier to evaluate how students are progressing year-over-year toward college readiness. They provide actionable feedback and detailed information to students and educators in score reports, including areas of academic strength and weakness, as well as actionable steps for improvement. They also present a more straightforward understanding of college and career readiness by using a definition that’s familiar to students and educators.
Did this answer your question?